Are you referring to the violin plot? https://en.wikipedia.org/wiki/Violin_plot and in Matplotlib as https://matplotlib.org/stable/api/_as_gen/matplotlib.pyplot....
It's in essence a histogram for the distribution, with smoothing, and mirrored on each side.
It looks nice, but is not without well-deserved opposition because 1) the use of smoothing can hide the actual distribution, 2) mirroring contains no extra information, while taking up space, and implying the extra space contains information, and 3) when shown vertically, too often causes people to exclaim it looks like a vulva.
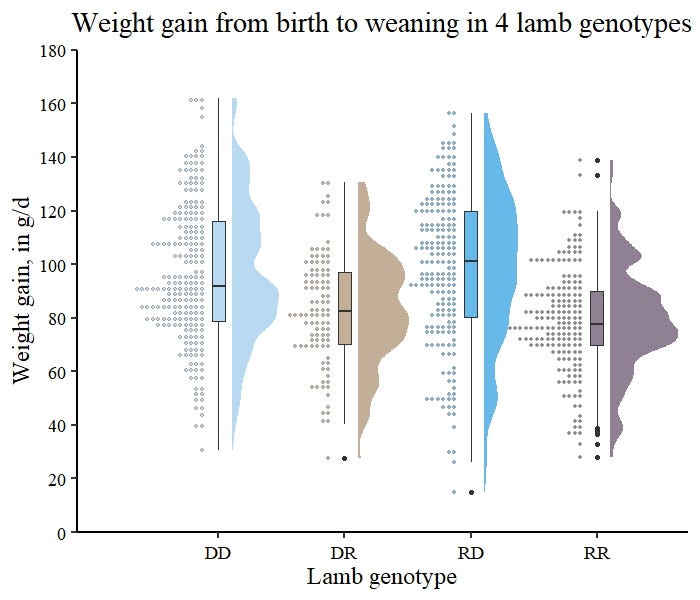
In an HN discussion on the topic, medstrom at https://news.ycombinator.com/item?id=40766519 points to a half-violin plot at https://miro.medium.com/v2/1*J3Q4JKXa9WwJHtNaXRu-kQ.jpeg with the histogram on the left, and the half-violin on the right, which gives you a chance to see side-by-side presentation of the same data.
Histograms aren't necessarily a true depiction of the distribution. Bin count or width has a large impact on what details get shown.