Although this has dropped off the FP now, I wanted to finish my response, but wanted to follow up with some data:
https://www.mikeayles.com/torque-rpm-time.png
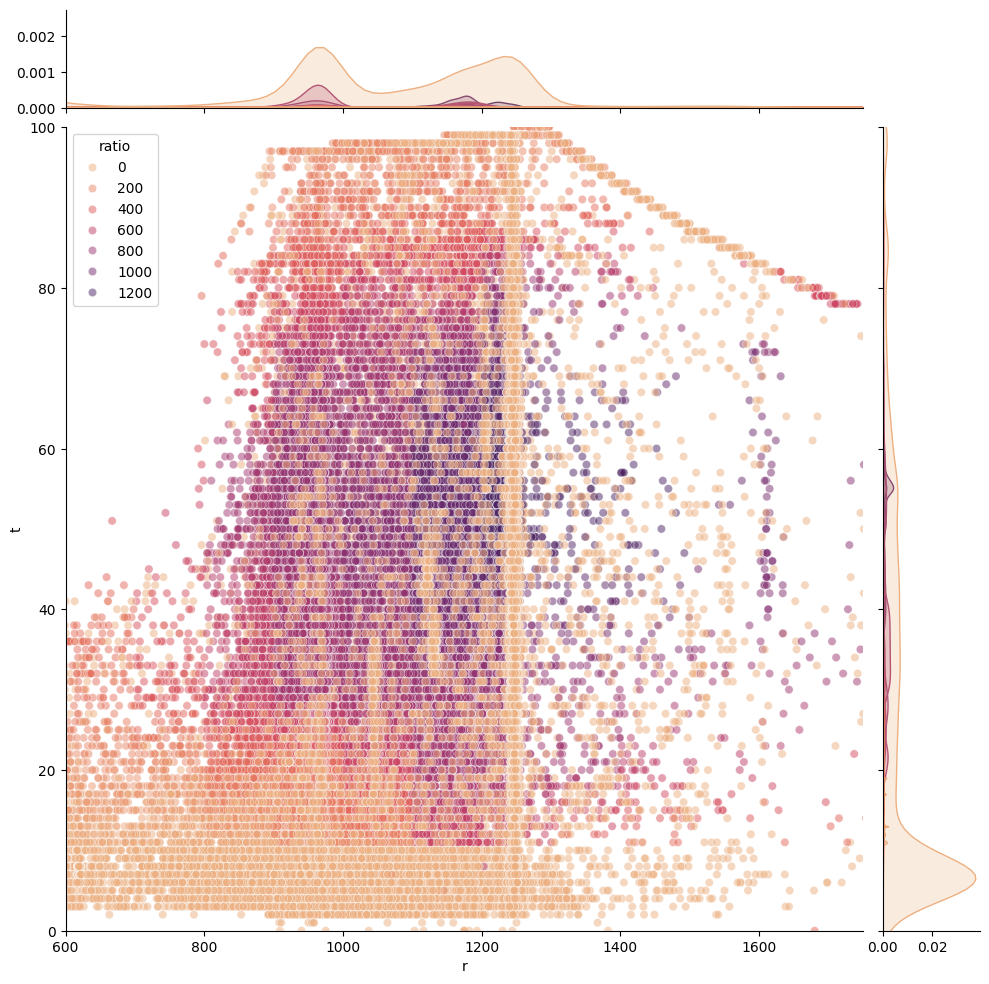
So, here is approximately a weeks worth of data (around 700l of diesel), looking at the histogram on the right hand side, theres an awful lot of time spent at 0-10% this is around 60% of the trucks time.
https://www.mikeayles.com/torque-rpm-volume.png
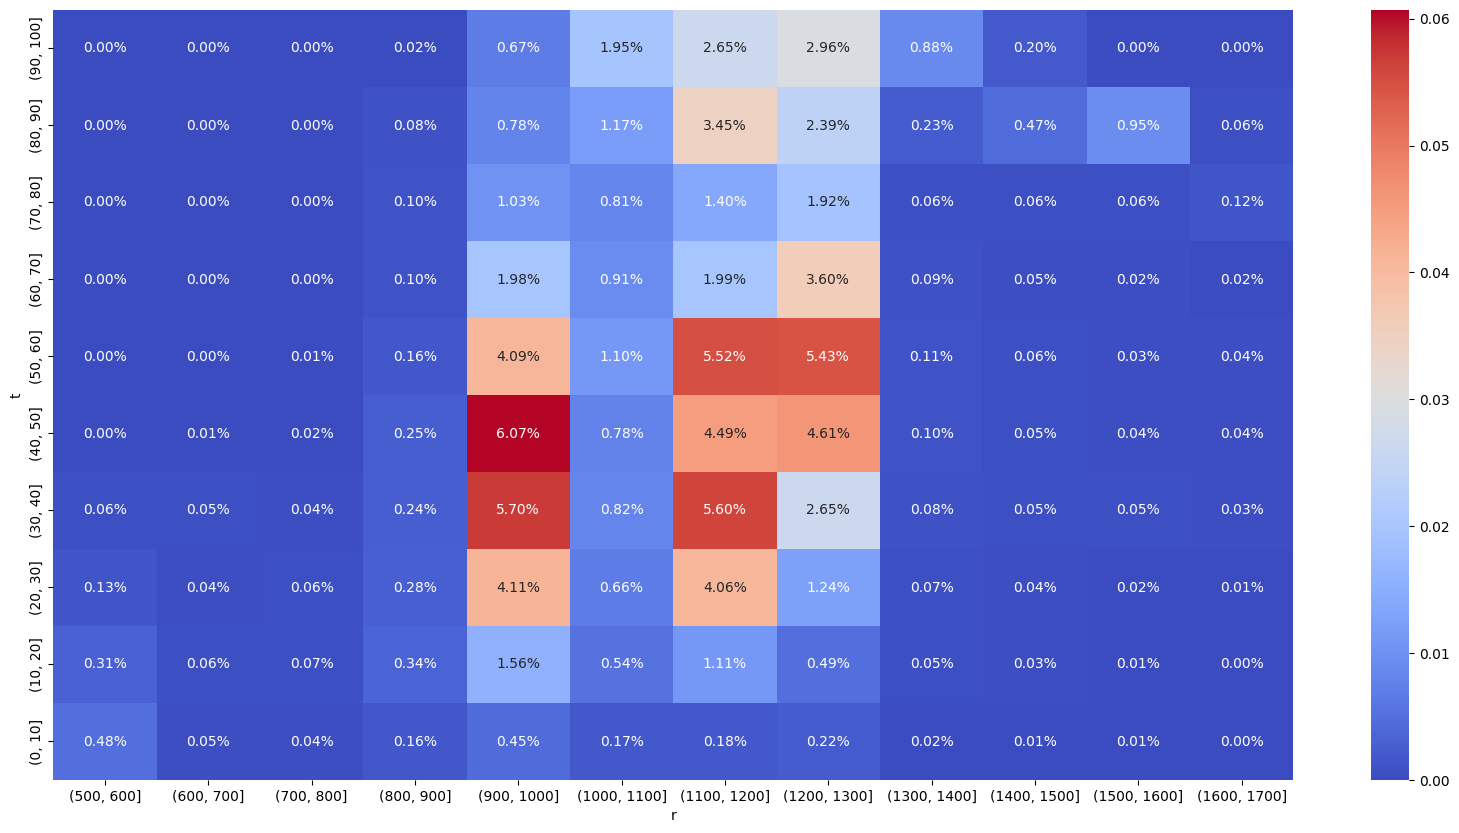
However, when you multiply the time by the fuel consumption within that same time period, you get a volumetric chart, where we can see that 60% of the time, accounts for only 2% of the fuel use.
So, for idling, whilst it's noisy, produces CO2, a 5% improvement at highway speed will get you so much more of a fuel and co2 saving than eliminating idle. although, both, do both.
What are the axes on the chart? Rpm?