 alt Hacker News
I highly recommend this graphic to everyone:
https://globaia.org/_astro/GA_1750-2024_DARK2.CKx3duw8_ZQd9m...
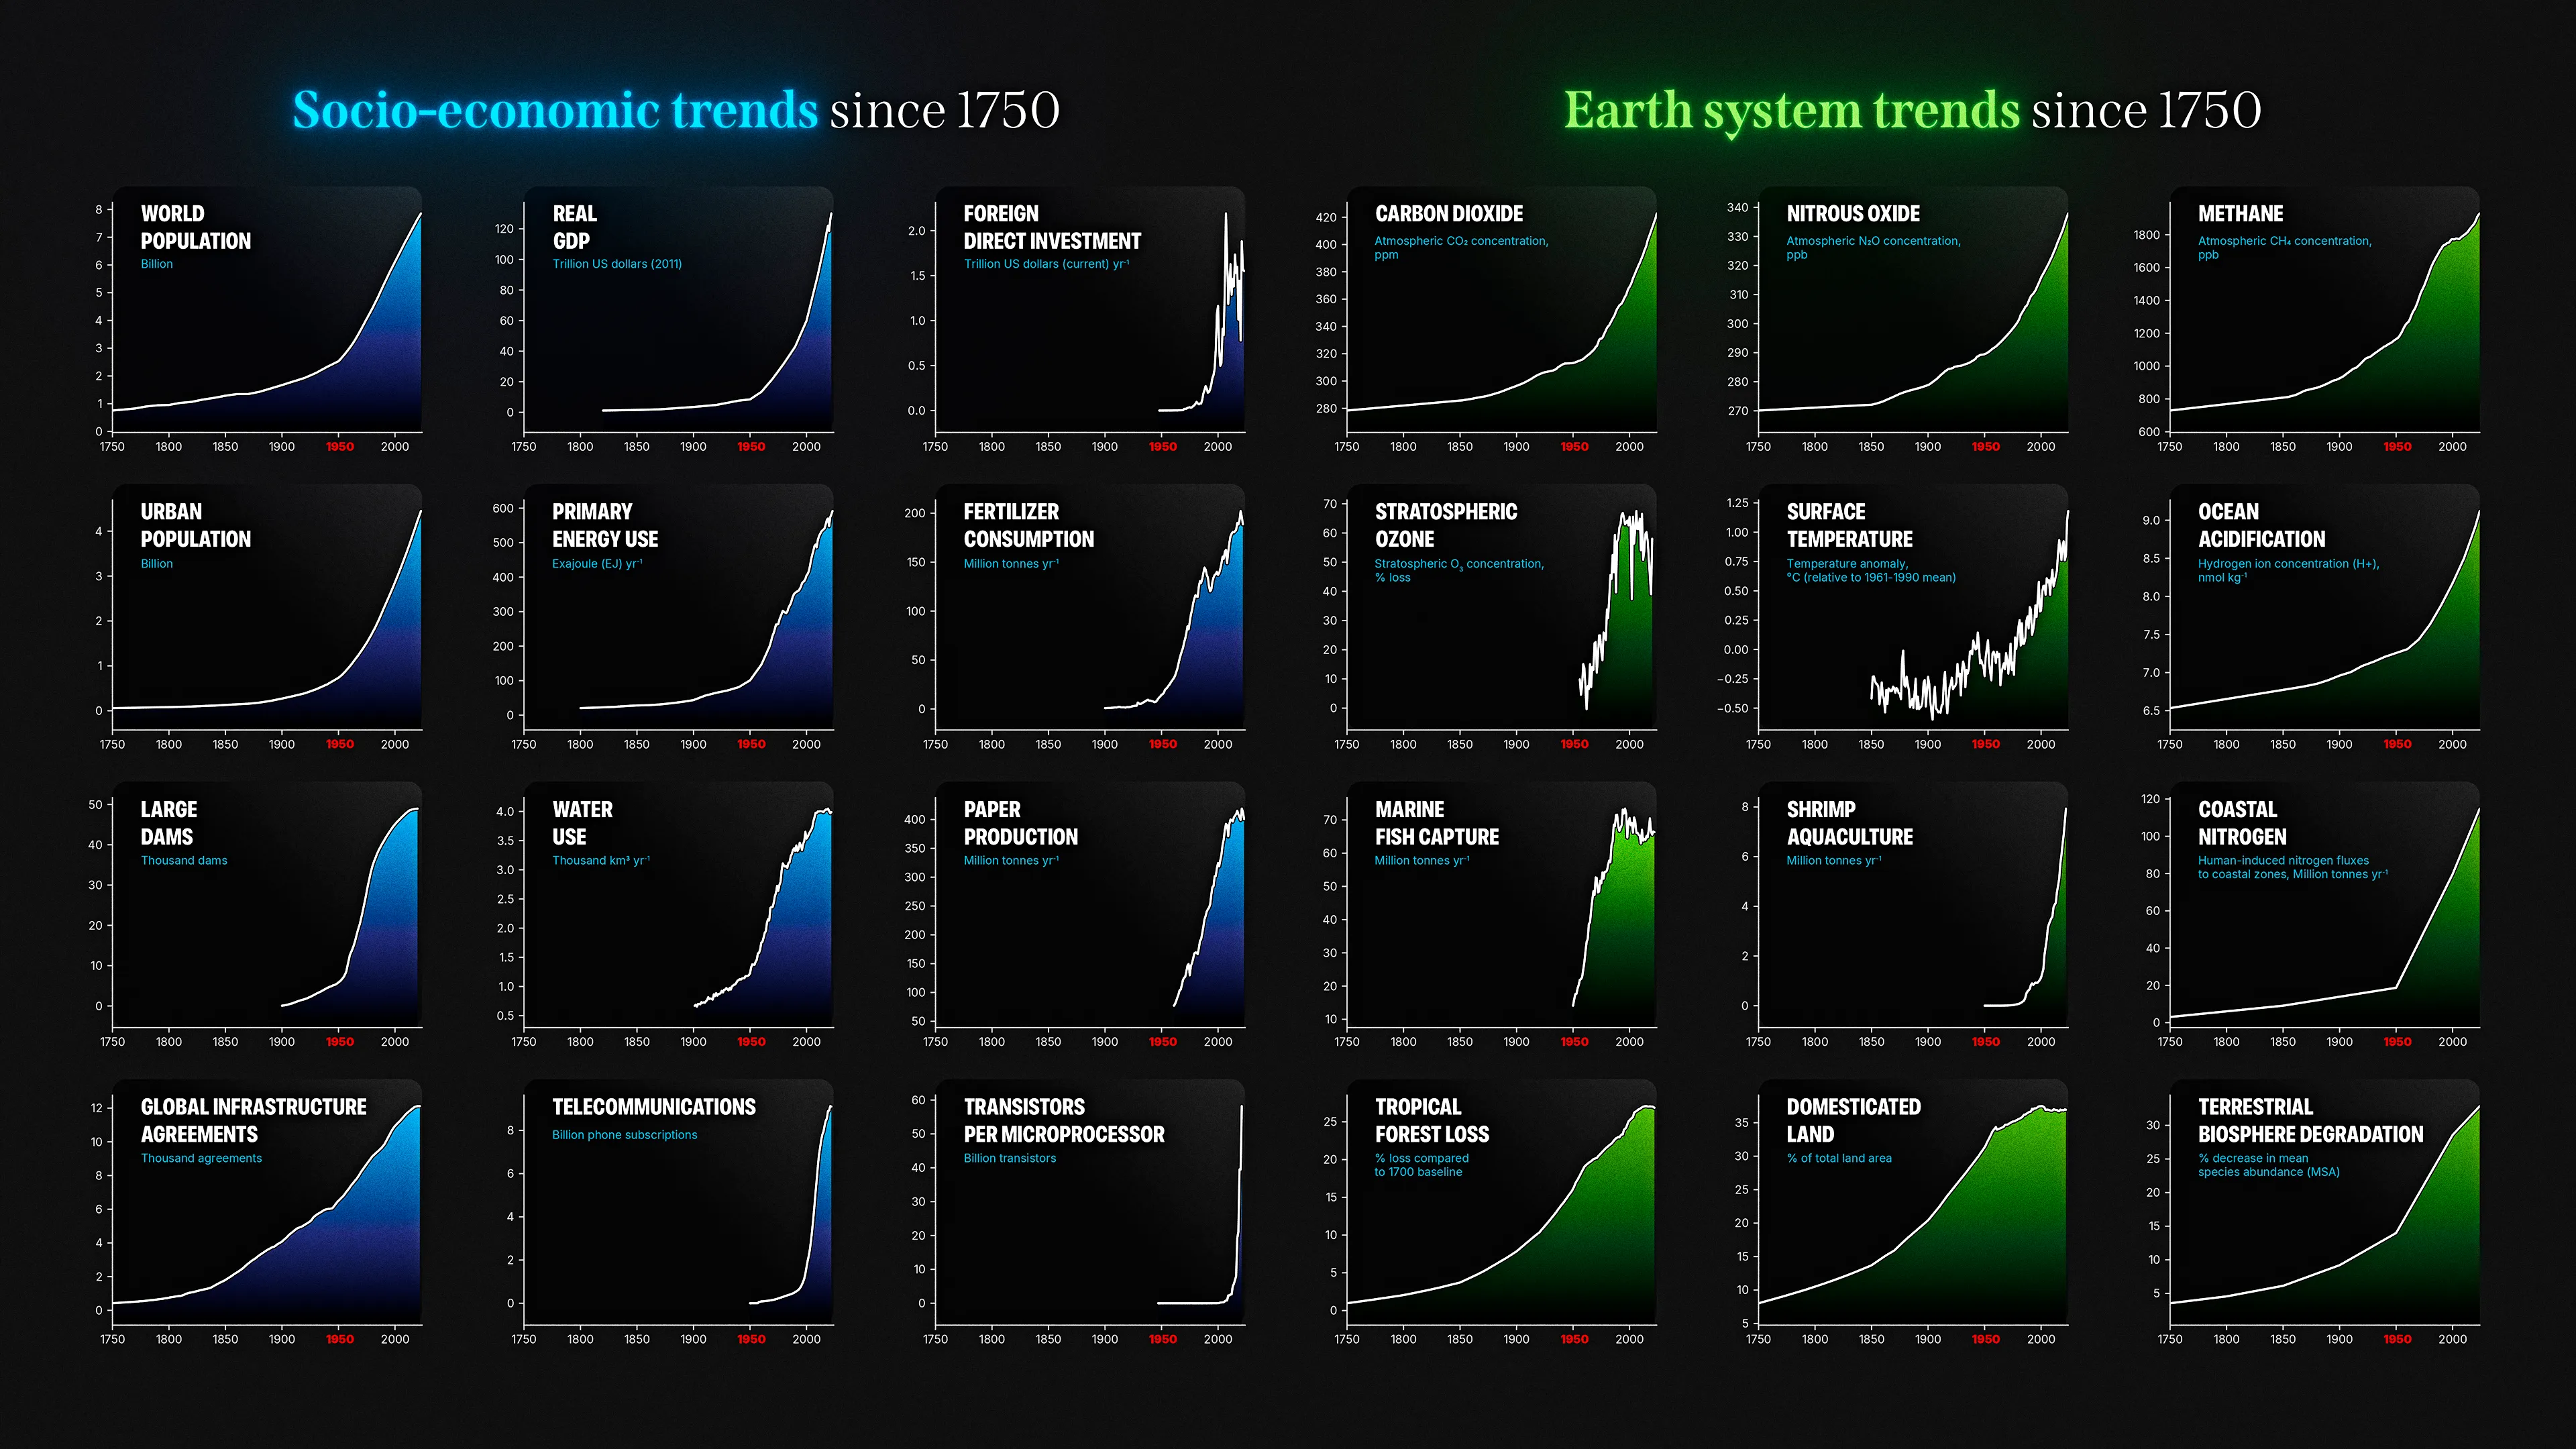
It lists 24 socio-ecological KPI across the planet since industrialisation beginning - as you can see:
There is not a single KPI where the curve shows even the slightest sign of recovery - and you can expect other graphs of adjacent KPI to show similar development.
In one sentence: There is no chance that humanity will ever come back to any pre-industry levels within the next 500 years. And by overusing our environment, our civilisation wont last 500 years. (sure, some hotspots will survive, but they wont have ASML Twin:Exe machines or cheap flight travel anymore etc.)
Replies
> pre-industry levels within the next 500 years
For instance there are more forests in much of Europe than we did before the industrial revolution, let alone the 1800s. e.g. more of France is covered in trees now than it was as far back as 1300. Of course that's a very narrow and specific "KPI", mostly just shows that humans already had a massive impact on the environment and ecosystems long before the industrial revolution.
The vast majority of countries in the world are aging. "Transistors per microprocessor" and "Phone subscriptions" are weird ones. As if the goal was to have sharp graphs...
We are not trying to literally revert the planet to how it was 100 years ago, we are "just" trying to stop these trends as soon as possible so they don't continue for another 100 years. There are going to be consequences regardless, but they can always get worse.
I agree on the "we're on the wrong path" though I don't share your conclusion's gravity, but some of these indicators feel very weird to be included imho. Total FDI and transistor per processor makes very little point on the matter.
Most growth is exponential (for a while, as a logistics curve (aka S-curve) does start exponentially), how about showing log(y(x)) instead of y(x).
But not always: if zero is not on the bar chart, e.g. log(y(x)) with [x] = Kelvin, such a plot will of course not work. So keep temperature as temperature increment over pre-industrial times or other baseline.
Also, does coastal nitrogen have three data points, or why the edge in the middle? Scatter charts plus trend are more the real thing than a curve if this is two linear relationships, with a second slope after a certain time, and keep y(x) plotting here, of course.
The world population graph is misleading. Looking at it one could be lead to believe that in 2100 there will be 13bln people.
In reality by 2100 the world's population will be around 10.2bln and declining from 10.3bln in 2084 or so.
And that also assumes the UN won't revise its projections once again, as every time they did, they had to lower their estimates.
>There is not a single KPI where the curve shows even the slightest sign of recovery
Ozone, I believe.
Ignoring the overly pessimistic and self-defeating overall tone:
> There is no chance that humanity will ever come back to any pre-industry levels within the next 500 years
How could you possibly predict this? We have moments of time in history which are basically "before/after", and no one saw those points coming until they were in effect. Electricity, atoms, nuclear energy, walking on the moon, transistors, internet, LLMs and more are examples of these things, that were short of impossible, and had lots of people claiming "We'll never do that in a hundred years!", up until we already accomplished those things.
What I'd like to know, is what the point is? Why claim "our civilisation wont last 500 years" and similar, what do you wish to achieve with this? What conversation do you wish your comment to spawn, that people tell you you are wrong? Or right?
> There is not a single KPI where the curve shows even the slightest sign of recovery
ozone, marine fish capture, tropical forest loss, and domesticated land are shown as below peak, aren't they?