 alt Hacker News
I'm implying they may be biased in what they chose to report on and how they frame it, yes. Deciding which figures to turn into a chart is an editorial decision.
I'm writing up a new version of the chart at the moment, but here's a preview: https://static.simonwillison.net/static/2026-11-01/5821A414-...
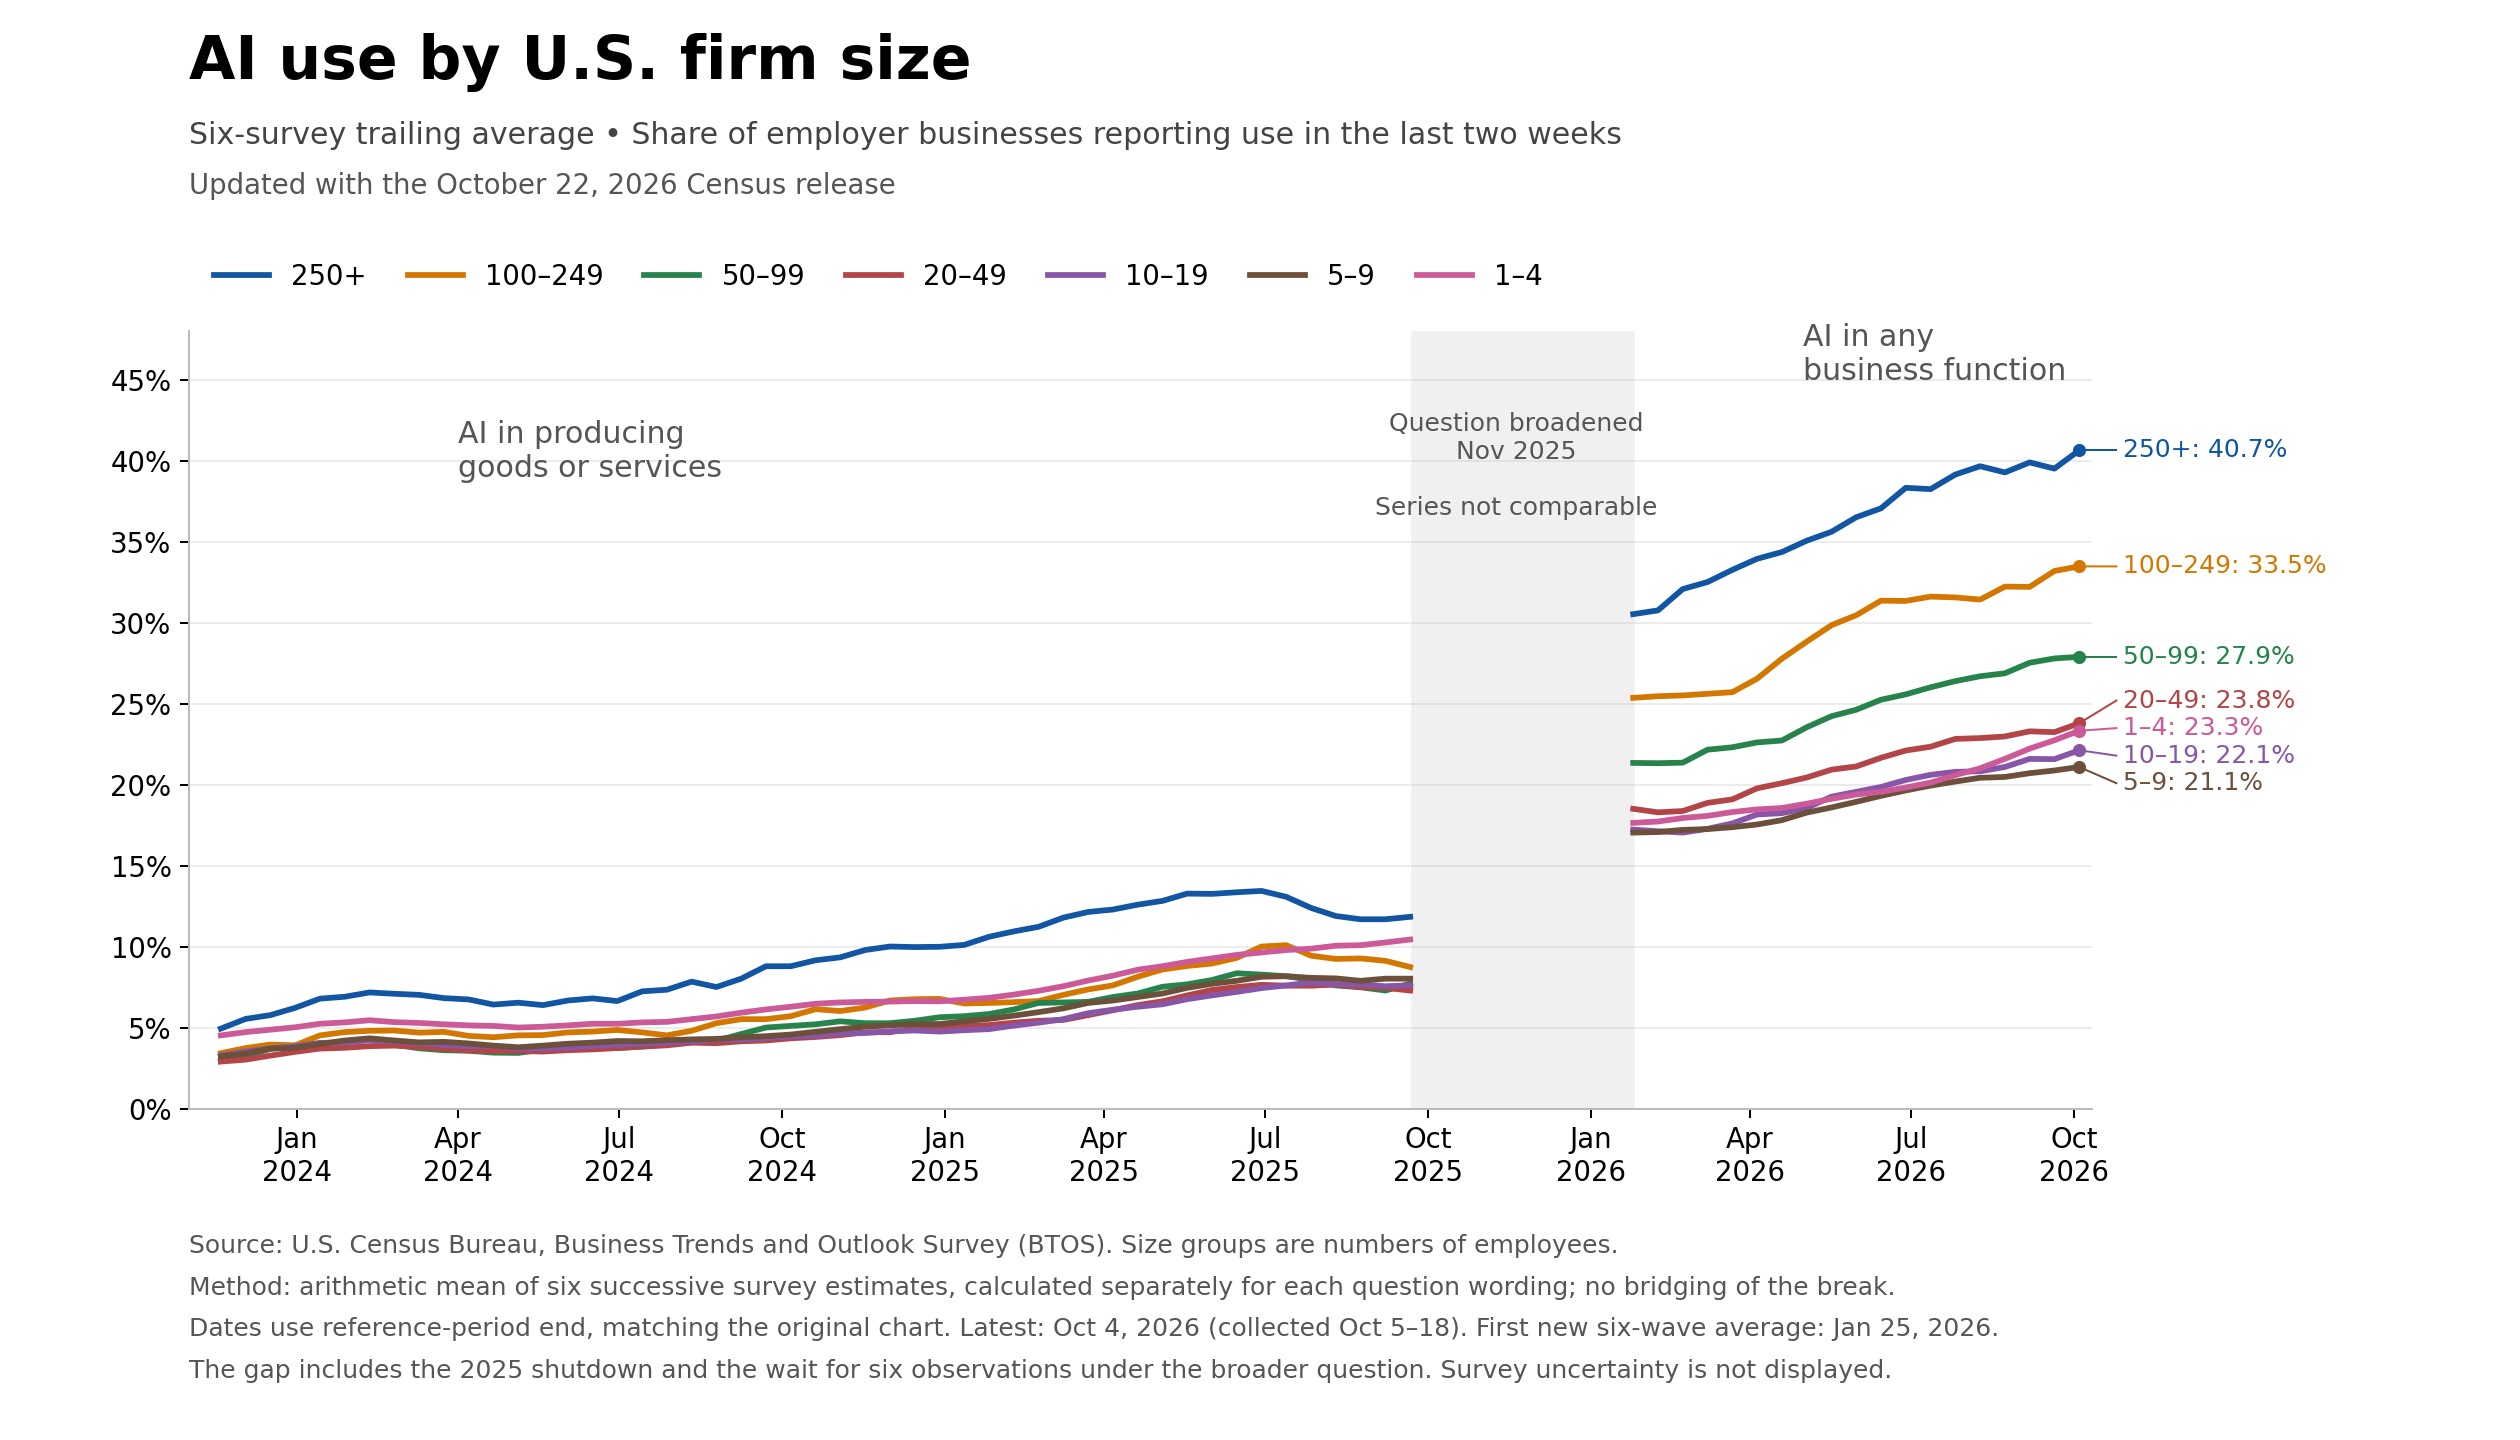
Notes on where to find the data here: https://simonwillison.net/2025/Sep/9/apollo-ai-adoption/